
Recently, I've been doing a lot of work using the programming language Python. It's become quite the language these days - I remember it being a fun aside in the early days of the program Blender as an internal scripting language. Now, it's everywhere! It certainly has some advantages - for one it's quick to write in. There's always a handy library around for the thing you need. Unfortunately, Python can also be a bit slow and while most of the time we might not care about what is going on underneath, sometimes it's necessary to know a bit more about how things are running.
I have a very large dataset I need to plough through - an awful lot of images with their associated metadata. I have a number of Python scripts running but they were quickly grinding to a halt. I figure it's time to do some profiling.
Profiling is where we look at a program during runtime to see where it's spending the CPU cycles and where the memory is being used. Once we know which areas of the code are taking the time, we can focus our efforts on fixing these parts first, hopefully improving our program's performance.

CProfile is perhaps the most well-known of the Python profilers - it's the first one I reached for. Like many of the profilers in this list you can either call it from within the script itself....
import cProfile
import re
cProfile.run('re.compile("foo|bar")')
... or from the command line.
python -m cProfile [-o output_file] [-s sort_order] (-m module | myscript.py)
The output is usually some lines of text listing the functions in your script that took the most time during execution, the number of times they were called and how long each call took.
One of the problems I had with cProfile is visualising the results - the text output isn't always the easiest thing to parse. Enter SnakeViz.
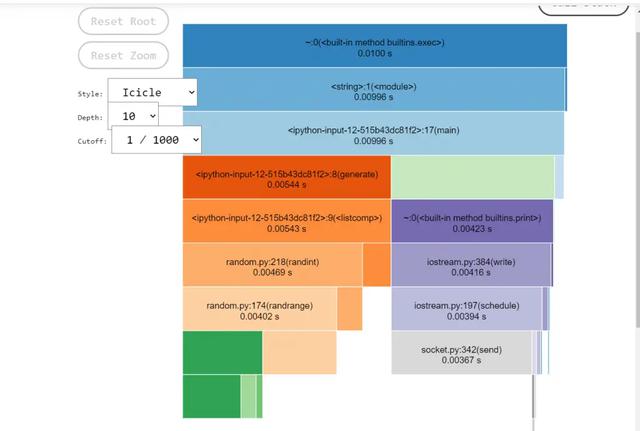
SnakeViz provides a web-based visualisation of the output from cProfile and was the second tool I started to use. It can be installed via Pip in the usual manner:
python -m pip install snakeviz
Once done, the next step is to profile the script with cProfile, making sure to send the output to a file (in this case, program.prof):
python -m cProfile -o program.prof my_program.py
Once done, you can launch snakeviz like so:
snakeviz program.prof
One of the potential issues with cProfile is the overhead and intrusiveness of it's method of profiling; it traces all the calls made. A program making many function calls would invoke the profiler a lot more than a program that just spends a long time crunching around a for loop. Profilers can effectively, distort the results. I'd seen a couple of odd things in some of the traces that made me think again. It was suggested that I try a statistical profiler like PyInstrument.
The difference is that rather than tracing every call, a program is sampled once a millisecond or so, in order to get a more realistic view of performance. For the most part, this is a bit more useful as I don't need to see every call - I just need to see the hotspots.
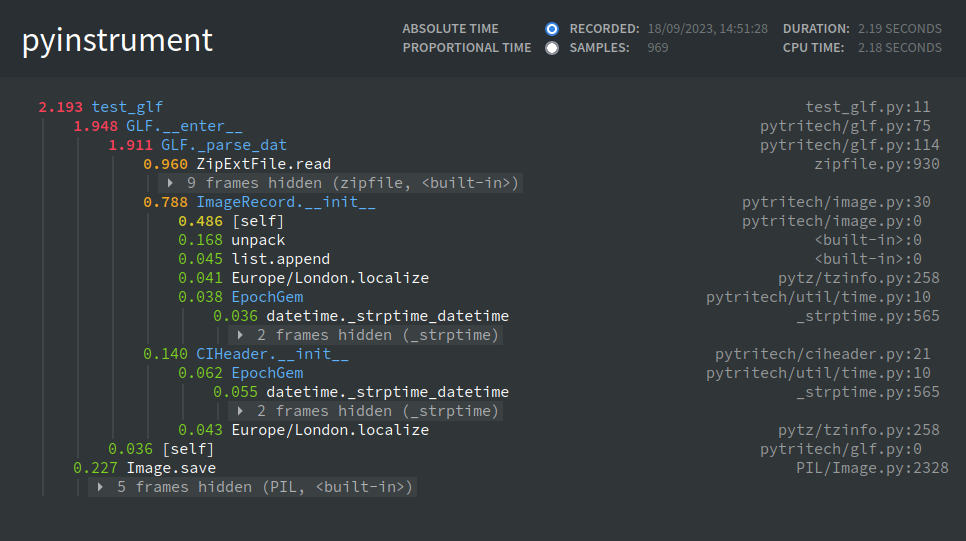
PyInstrument has a number of outputs including a nice console / text like affair which gives a nice overview, but interactive options with HTML are also available.
I've not really used Guppy very much. One of the modules within is called Heapy. The module can loaded within your python script and will print out the state of the heap including which elements had the most allocations. I've yet to use it in anger though, but it's on the list to try.
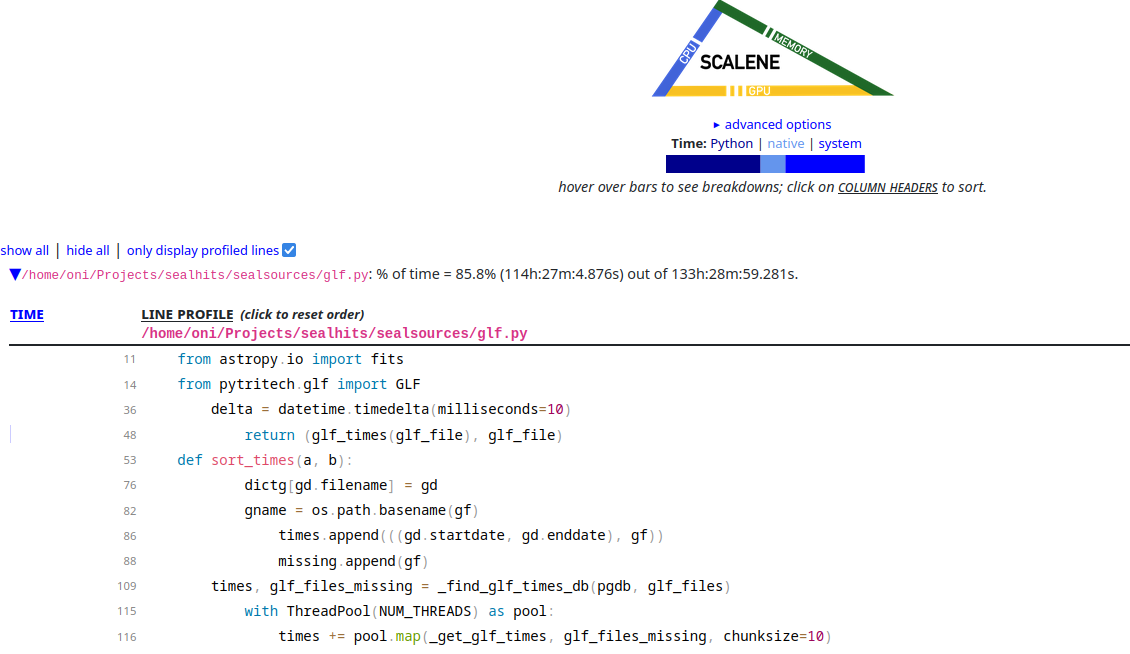
Scalene claims to do a lot of things; cpu, gpu and memory profiling, but also seems to include something called 'AI-Powered proposed optimisations'.
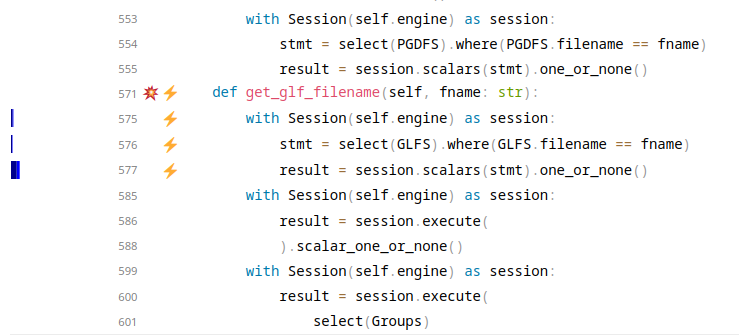
From what I can tell, this process involves submitting the code to an OpenAI server and doing something. I've not yet had any luck with this process so I can't report back but colour me intrigued!
Scalene can also profile the GPU apparently, though this crashed my script when I ran it with this option left on. I had to turn it off using the deprecated option cpu-only. Still, it doesn't appear to get in the way of the program very much and the output is very easy to follow.
A few of you may have noticed I've not done any memory profiling and you'd be right! Scalene claims to be able to do that and it's next on my list to try.
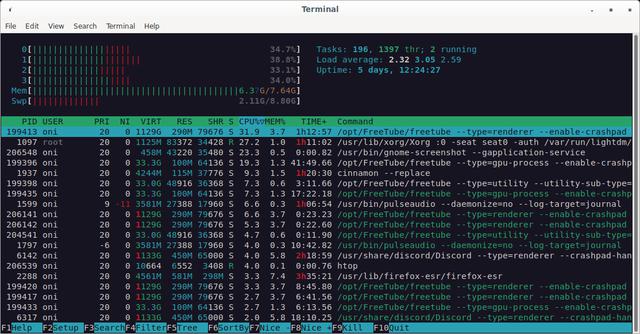
I quite like the program htop - it gives you a good overview of what a system is doing and will also monitor I/O if you set it up right. You can watch to see if you are running out of memory, if your CPUs are being used thoroughly or which process is accessing your disk more than you'd like.
I did try atop too and I'd definitely recommend giving it a go if things start to run poorly. One of my programs was behaving badly and I found out that it was paging to disk far too much! Such things are easy to spot as atop will highlight any areas it thinks are off in red.
In my little example I found out that the key issue I was having was to do with Python's ZipFile module. It turns out this library isn't the fastest. Focusing down, I removed as many calls as I could to ZipFile and switched to Python ISA-L and achieved some good speed-up. Not too shabby really. If I was just unzipping one file it'd be fine, but when you have to do hundreds-of-thousands it really adds up.
The answer may not be in the code you've written. In my experience, it often is the code you wrote yourself (eeep!) but a profiler should get right to the heart of the problem, wherever it is.
