It's important to measure things in science. In our attempts to be as objective as possible, we need to create reproducible experiments with measurable results that other folks can verify for themselves. It's also really handy to have hints as to which directions we should take. We are venturing into the unknown, so all sign-posts are helpful!
There's more to measuring than just the data though. How do we organise it so we can use it later? What does our backup system look like? Which visualisations do we want to use and how do we present our findings to others? A lot of questions there, and a lot of things for a single PhD student to tackle.
I've had a few ups and downs with my research and what we measure, but I think I've come up with a reasonable solution that might be useful for folks working in A.I. with either PyTorch or Tensorflow.

So where did I begin? In a nutshell, my neural networks generate a model out of a point cloud using a small set of continuous variables and a set of points. This leads to a different sort of architecture than your typical classifier style network. Nevertheless, there are some similarities.
My requirements for recording each experiment were as follows:
The last point is critical! This needs to be easy. I don't mean over-engineer but definitely putting the plumbing in to make this quick. That way it gets done everytime and the chances of losing things goes down.
A lot of folks tend to use tensorboard. I've used that in the past but it tends to create massive files and I really only used a small subset of the functions on offer. I figured some sort of website that could load images and json data from a directory would be perfect. Having already gotten a nginx server setup with uwsgi I figured a small python flask application would do.
So I set to - creating a statistics script in python that would interrupt training to run the model in test mode, creating a bunch of stats. I had functions that recorded the errors, the various variables we were interested in, several images - all the things we figured we'd need. I had a few other python files too that would generate JSON files from the OBJ point clouds I was generating, to python scripts that would generate animated gifs.
All of these python scripts were called from a single bash script, which also called programs like imagemagick to make things like montages (which I covered in a previous blog post). Finally rsync or SCP was used to move the files from my AI box to the web-server.
Once the files were uploaded, a user could view the results by visiting the webpage, at which point the flask application would check the directories on the disk and present a list accordingly to the user. The user could select an experiment and the flask application would present the links accordingly.
This scheme worked really well for quite sometime, until it didn't!
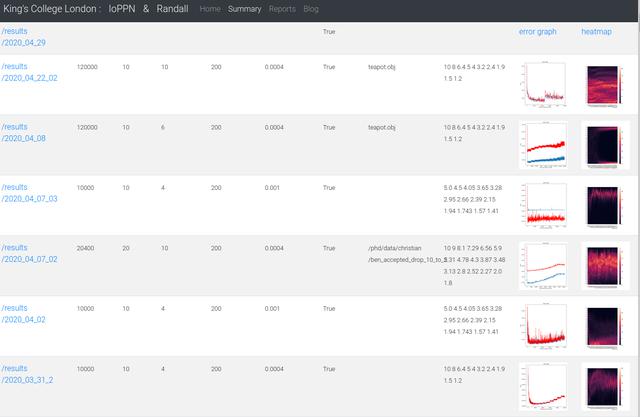
One of the problems with the first approach was the heterogeneous nature of the output. Sometimes, we'd save the intensity of the images, other-times not. Sometimes a run might include extra variables, other-times we'd turn them off. The one-size fits all nature of the website and the stats script meant constant changes to the codebase, resulting in un-wieldly files, missing images on the website and not knowing how to regenerate some of the results.
The second problem revolved around the ad-hoc file-formats for saving the data. Most were CSVs but without heading columns. Even if there were headings, making sense of these raw files would be difficult.
The third problem was speed and access. If I only wanted a subset of the data, or if I wanted to search the data, it would take a fair bit of time; reading in a large text file in it's entirety just to get at a few data points.
Finally, comparing results across experiments was very difficult and not so easy to follow once it had been completed. Something new was needed. I drew up another set of requirements:
This is perhaps where science and engineering differ a little. Science just wants the results; we could just carry on with what we have and focus more on trying new things. Engineering, on the other-hand, is raising these alarms bells, saying I need to refactor. In the end, I think both of these incentives are correct; balancing them out is part of the art.
I didn't want to use a database to begin with. Keeping the experiments to a minimum seemed good for reproducibility. In addition, saving all the results to a set of files in one directory made backup really easy. So I looked for a solution and found TinyDB.
TinyDB stores your data as a JSON file on disk. This seemed like a great idea as I could store different data for each experiment really easily; I didn't have to define a schema in advance, for every possible permutation of my code.
The problem with this approach soon became apparent - the clue was in the name. TinyDB couldn't cope with the size of the files I was generating. A 3 gig JSON file is not a fun thing to process. I had to give up on this method pretty quickly!
I had to bite the bullet and go with some external database service in the end, but which to choose? I'm a big Postgresql fan but in this case, I can't have a schema up-front and I don't need any advanced queries or relationships.
I like the document store idea. Postgresql does have a way of storing JSON types and can do the document thing but it seemed a little bit complicated and heavyweight to setup.
I tried mongodb and couchdb to see if they were any better? I don't know why I keep trying mongodb - it always lets me down. It couldn't digest my 3G JSON file at all - scalability my arse! Maybe I'm just doing it wrong, but I've a reasonable amount of engineering experience so I think the problem is with mongo. Couch seemed nice but again, it had trouble digesting my file.
I went onto the UKRSE slack channel (a friendly resource for all things programming) and asked around. A few things were suggested but I ended up going with Redis - something I'd heard about and wanted to learn but hadn't had the chance or excuse to try.
Redis isn't really a database or a document store per-se. It's more of a cache-like-thing that holds key-value pairs. It's also really quick, dead easy to install and comes with several useful features including master-slave replication. There is a python library that is insanely easy and quick to use, and a good install candidate for Ubuntu. I must admit, I can't think of a single DB-like application that has been easier and quicker to setup!
In fact, the master-slave replication was an added bonus! I can automatically sync the AI database to the web one as training progresses which is brilliant - paving the way for real-time monitoring later on no doubt. I use Wireguard to secure the link between the two boxes, making sure no ports or data are exposed to the internet.
My python stats script was getting quite bloated! Several parts were commented out, other bits didn't work any more and the whole thing was beginning to smell a little bit. Now I knew I was using Redis, the stats logging could be completely overhauled.
I wrote a static class that can be imported easily and records whatever object you pass to it, with a specific label. At every logging step, the stats class writes out these objects with the correct timestamp to whatever back-end we happen to use. Different versions of the code can simple add more one line object watches or remove ones that aren't applicable. Sorted!
Here is my current stats object. I can create a single object inside the stats.py script and then call the watch function on any variable I'm interested in. Much easier!
class Stats(object): """ We used a stats object as we have streams and all that sort of thing."""
def __init__(self):
    # create a stream for logging
    self.watching = {}

def on(self, savedir: str):
    self.savedir = savedir
    path = os.path.normpath(savedir)
    parts = path.split(os.sep)
    self.exp_name = parts[-1]  # WARNING - overwrite potential in the REDIS
    self.R = redis.Redis(host='localhost', port=6379, db=0)

def watch(self, obj, name: str):
    """ Add something to be watched via tensorwatch. This may already be
    watched but we want to update the reference as we may have created a
    new object in the meantime."""
    self.watching[name] = obj

def close(self):
    """ Make sure we write to the DB. """
    pass
    # TODO - will probably get rid
    # self.db.close()
    # Zip now happens in the generate_stats.sh script
    # with ZipFile(self.savedir + "/stats.zip", 'w',
    #             compression=ZIP_DEFLATED) as myzip:
    #    myzip.write(self.savedir + "/stats.json", arcname="stats.json")

def tensor_to_list(self, tensr: torch.Tensor) -> list:
    """ Convert our tensor to a list to write out. """
    if tensr.device.type == 'cuda':
        tensr = tensr.detach().cpu()
    np_array = np.asarray(tensr.detach().numpy())
    return np_array.tolist()

def _rconv(self, list_obj: list):
    """ recursive look through the lists to do conversion. """
    new_contain = []
    for item in list_obj:
        if isinstance(item, list):
            new_contain.append(self._rconv(item))
        elif isinstance(item, torch.Tensor):
            new_contain.append(self.tensor_to_list(item))
        else:
            new_contain.append(item)
    return new_contain

def _conv(self, obj, name: str,  epoch: int, step: int,
          idx: int):
    # Now check what the object is and write it out properly
    # Using one letter keys to save a little space.
    key = self.exp_name + ":" + name
    if isinstance(obj, str):
        self.R.zadd(key, {json.dumps({'epoch': epoch,'step': step, 'data': obj}): idx })
    elif isinstance(obj, torch.Tensor):
        converted = self.tensor_to_list(obj)
        self.R.zadd(key, {json.dumps({'epoch': epoch, 'step': step, 'data': converted}): idx})
    elif isinstance(obj, list):
        new_list = self._rconv(obj)
        self.R.zadd(key, {json.dumps({'epoch': epoch, 'step': step, 'data': new_list}): idx})
    else:
        self.R.zadd(key, {json.dumps({'epoch': epoch, 'step': step, 'data': obj}): idx})

def update(self, epoch: int, set_size: int, batch_size: int, step: int):
    idx = epoch * set_size + step * batch_size
    """ Update all our streams with the current idx value. """
    for name in self.watching.keys():
        obj = self.watching[name]
        self._conv(obj, name,  epoch, step, idx)

def write_immediate(self, obj, name,  epoch, step, idx):
    self._conv(obj, name,  epoch, step, idx)

def save_jpg(self, data: torch.Tensor, savedir: str, prefix: str,
             epoch: int, step: int, idx: int):
    util.image.save_image(data, name=savedir + "/" + prefix +
                          str(epoch).zfill(3) + "_s" + str(step).zfill(5) +
                          "_i" + str(idx).zfill(5) + ".jpg")

def save_fits(self, data: torch.Tensor, savedir: str, prefix: str,
              epoch: int, step: int, idx: int):
    util.image.save_fits(data, name=savedir + "/" + prefix +
                         str(epoch).zfill(3) + "_s" + str(step).zfill(5) +
                         "_i" + str(idx).zfill(5) + ".fits")

def save_points(self, points: torch.Tensor, savedir: str, epoch: int,
                step: int, ply=False):
    '''Save the points as either an obj or ply file.'''
    path = savedir + "/shape_e" + str(epoch).zfill(3) +\
        "_s" + str(step).zfill(5)

    vertices = []
    tv = points.clone().cpu().detach().numpy()
    for v in tv:
        vertices.append((v[0][0], v[1][0], v[2][0], 1.0))

    if ply:
        save_ply(path + ".ply", vertices)
    else:
        save_obj(path + ".obj", vertices)
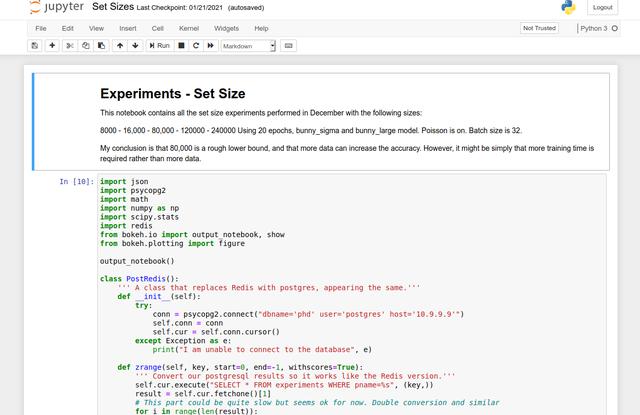
Jupyter notebooks are used all over the place it seems! I've always steered clear of them in the past, as a python script, decent text editor and a terminal usually suffice. But in the case where I need to share some data, graphs and the means these graphs were made, Jupyter seems like the perfect solution.
I started by trying Jupyter Hub, specifically The Smallest Jupyter Hub. I had a lot of trouble getting it setup, and found it impossible to run as a non-root user. As a rule, I don't run anything web-facing as root if I can help it. I certainly don't trust this application enough for that, so I settled on the basic, single user Jupyter Notebook server setup.
For graphing, I'd heard about the Bokeh project which seems very nice indeed! It's a mixture of Javascript and python. You can generate the same graphs in both languages and it works surprisingly well. It's a tad more intuitive than matplotlib, generates interactive graphs and works well with Jupyter Notebooks. So far, the only thing I've found hard to generate is a heat-map.
Moving towards a more dynamic solution for recording and visualising the statistics from our neural network has been a big help already. It's much faster to upload, backup and visualise all the parameters I need.
It's much neater inside the code too. We can quickly see what we are recording and add new watches with little overhead. Our graphs are much tidier, the data more organised. It's taken a while to get to this point; it's not always clear up-front what the ideal solution might be.