
I was struggling with a pytorch problem for a few days that really got under my skin. I had a series of tensors representing offsets in my little 3D model and I wanted them to be updated via a loss function and back-propagation. Problem is, they weren't being changed at all.
The biggest problem I have with PyTorch are the side-effects. Part of that comes from Python but I can't shake the feeling that a lot of things are being done in-the-background, ostensibly to make my life easier. However, just sometimes, this results in an awful lot of pain.
In both Tensorflow and PyTorch, a lot is made about the compute graph and Autograd. In a nutshell, all your operations are put into a big graph. Your tensors then flow through this graph and pop out at the other end. Fairly simple really. The reason for this is we can build a set of operations for which we can create derivatives. These derivatives are crucial for A.I. This has been covered elsewhere in many places so I won't repeat it here.
Originally, this graph was static. When I worked on the antibody project in tensorflow, you had to build the graph statically and once it was made, load it into a context and you were good to go. This could be difficult to get right, and it seemed a little clunky but it did do one important thing:
If you got it wrong you were told you got it wrong
It was fairly painful in the early days but I likened it to compiler errors. It's nice to have that free check before you load all your nets onto a GPU for training.
Dynamic graphs do allow some more flexibility and feel more intuitive though. You can fairly easily swap parts in and out, even as the program runs. There is appeal in that.
I think, on the whole, I prefer static graphs - or rather, I'd like a sanity check on the graph. I want to know what it looks like, what it will do and whether or not my gradients are getting to the right place or not. We need some tooling!
The first step is complaining and getting angry! The next step is to think of why this is the case? The final step is to build a tool and fix it! Maybe afterwards, you share it with the world because other folks may be struggling with the same issues.
I really wanted a tool to see the compute graph. I started looking at pytorchviz but this didn't work for me out-of-the-box, so I figured I'd write my own. I wanted a terminal and image based approach so I could just run a quick test to make sure things are how they should be.
The pytorch documentation is quite sparse on how the innards work, however the source is available. As I understand it:
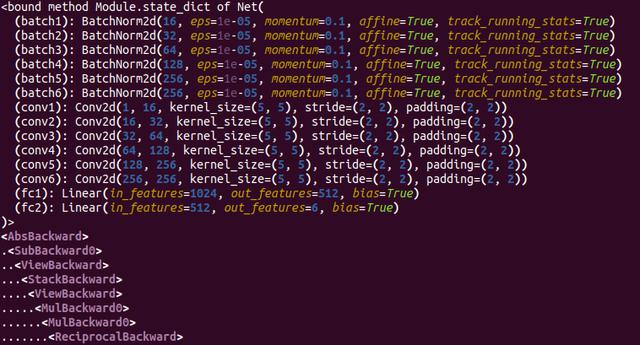
The leaf-nodes are so called because they are the ends of the compute graph tree if you will. It is here where the gradients of our back propagation are applied; where the rubber hits the road so-to-speak.
So, we have the basis for our tree. We can write a recursive function to traverse our newly found graph (I quite like recursion) and print out each method and anything associated with it. There are a couple of gotchas though.
With these two additions, we have our graph! I wanted to visualise this in a nice way, so I got some handy unicode characters to brighten things up, installed the rich python library for some pretty formatting and colours, and the graphviz wrapper to generate images. I'd tried the pyvis module but it can't handle large hierarchical graphs very well and doesn't appear to be maintained, so venerable old graphviz it is!
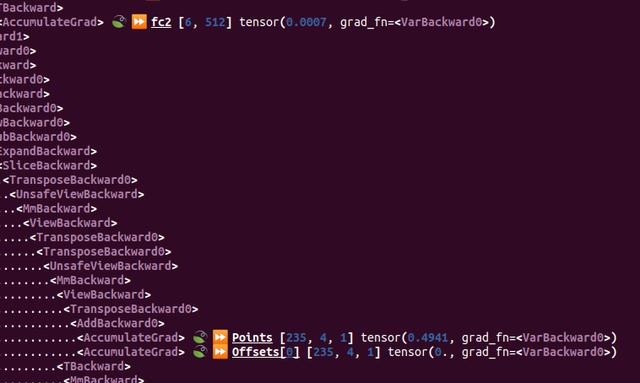
Once I'd built this tool, I set to work bug hunting. I noticed that there was a leaf node being output at the right place, right next to another tensor with a name I recognised. But why was this tensor not being recognised? It was as if the result I wanted was being thrown into the void and not ending up in the right place.
Turns out the problem was using a PyTorch view on the tensor, in order to get it to fit. My graph was expecting a set of 4D vectors in the form:
[[x], [y], [z], [w]]
My vectors were a bit easier to grok, in the form
[x, y, z, w]
So in order to get them to fit, I ran them through a quick reshape:
target = target.reshape(-1,4,1)
Now you'd think PyTorch would be happy with this. Turns out it wasn't and this little change was creating some new tensor that wasn't linked to the variable I was expecting. I'm still not 100% clear on what the issue really is but at least I'd found a fix! Once I'd removed the reshape I ran the model check again and it worked!
Tensorflow has a good set of visualisation tools in it's tensorboard package. While they are quite heavyweight, it's clear there is a need for them. We have debuggers and visual tools for a reason, and I think PyTorch is missing one or two of these; in fact I have another post in mind about visualising results from PyTorch.
It always seems like a pain to have to make little tools like this to fix a bug you know will be trivial just because there isn't a verification step. Surely, you might say, something must already exist to help me fix this? Most of the time there probably is but in some cases, I suppose you just need to roll up your sleeves and crack on! It helps that I learned a little bit about some fun libraries and terminal text formatting; makes it all a bit more palatable.
Here is the code in full for these interested. I've posted it up as a github gist as well.
# Our drawing graph functions. We rely / have borrowed from the following
# python libraries:
# https://github.com/szagoruyko/pytorchviz/blob/master/torchviz/dot.py
# https://github.com/willmcgugan/rich
# https://graphviz.readthedocs.io/en/stable/


def draw_graph(start, watch=[]):
    from graphviz import Digraph

    node_attr = dict(style='filled',
                    shape='box',
                    align='left',
                    fontsize='12',
                    ranksep='0.1',
                    height='0.2')
    graph = Digraph(node_attr=node_attr, graph_attr=dict(size="12,12"))

    assert(hasattr(start, "grad_fn"))
    if start.grad_fn is not None:
        _draw_graph(loss.grad_fn, graph, watch=watching)

    size_per_element = 0.15
    min_size = 12

    # Get the approximate number of nodes and edges
    num_rows = len(graph.body)
    content_size = num_rows * size_per_element
    size = max(min_size, content_size)
    size_str = str(size) + "," + str(size)
    graph.graph_attr.update(size=size_str)
    graph.render(filename='net_graph.jpg')


def _draw_graph(var, graph, watch=[], seen=[], indent="", pobj=None):
    ''' recursive function going through the hierarchical graph printing off
    what we need to see what autograd is doing.'''
    from rich import print

    if hasattr(var, "next_functions"):
        for fun in var.next_functions:
            joy = fun[0]
            if joy is not None:
                if joy not in seen:
                    label = str(type(joy)).replace(
                        "class", "").replace("'", "").replace(" ", "")
                    label_graph = label
                    colour_graph = ""
                    seen.append(joy)

                    if hasattr(joy, 'variable'):
                        happy = joy.variable
                        if happy.is_leaf:
                            label += " \U0001F343"
                            colour_graph = "green"

                            for (name, obj) in watch:
                                if obj is happy:
                                    label += " \U000023E9 " + \
                                        "[b][u][color=#FF00FF]" + name + \
                                        "[/color][/u][/b]"
                                    label_graph += name

                                    colour_graph = "blue"
                                    break

                            vv = [str(obj.shape[x])
                                for x in range(len(obj.shape))]
                            label += " [["
                            label += ', '.join(vv)
                            label += "]]"
                            label += " " + str(happy.var())

                    graph.node(str(joy), label_graph, fillcolor=colour_graph)
                    print(indent + label)
                    _draw_graph(joy, graph, watch, seen, indent + ".", joy)
                    if pobj is not None:
                        graph.edge(str(pobj), str(joy))