I've not spoken a lot about my research of late. Being a PhD student, I'm still learning how to science; I'm always heads-down, busy fixing code, running experiments and such. Such things don't strike me as very compelling for readers, especially the technical kind, but I've had a think, and there are a few technical topics I can talk about.
I'd like to start with images, or data. Working with microscopes a lot, you tend to come across image data often. Whether that be STORM localisations, fluorescence images, or MATLAB matrix files, there is an awful lot of data best represented as a two dimensional grid of numbers, in either greyscale or RGB. Manipulating these easily, and at scale, has been really important to my work.
Yeah, that's right - I use all four of these regularly and probably more besides. They each have their pros and cons when it comes to research. Some are great for quick visualisations. Others are better for processing and recording results. I've found that working in AI and biology, you need to manipulate lots of different formats. Swiftly and easily going between them is paramount.
Tiff images are one of these formats that has gotten out of hand! The specification for tiff is somewhat large and mad! It's been around for a while, and is up to version 6 at time of writing. Most of the tiff images I deal with contain what biologists call Z-stacks. Essentially, these are images within the image, but they often represent the same object, imaged at different depths with a microscope.
One problem that came up at the Turing Data Study Group I attended, was the support in python for 16bit tiffs. The de-facto image library Pillow (based on PIL) doesn't support them correctly. 16bit tiffs are pretty common in biology.
Other python libraries are available that deal with tiffs. pyopencv is one of them, though it is a little heavy weight. libtiff and matplotlib can also deal with tiffs. Recently, I've found tifffile to be very useful with stacked, 16-bit tiffs though it is a little heavyweight, relying on the imagecodecs package.
I'd not heard of the Flexible Image Transport System format before I started working on this AI project. Apparently, it's used for shipping data formatted in rows, columns and tables, so basically an image with multiple layers if you will. It's associated with NASA (https://fits.gsfc.nasa.gov/) and is used predominantly within the astronomy community.
The main advantage is the format can work with floating point values and there is support in python through the Astropy library. This makes it a good choice to working with our microscopy data.
Animated gifs are handy for many things, not just memes! I tend to export animations to both mp4 and gif format, as both are handy for posting on twitter, slack and the like. Animation has been a big help when visualising our results.
jpg is quite handy when we need to compress our images down. For each run, I typically generate masses of fits files which are difficult to see altogether. Converting them to jpg significantly improves speed and management, when all I need to see is a general overview.
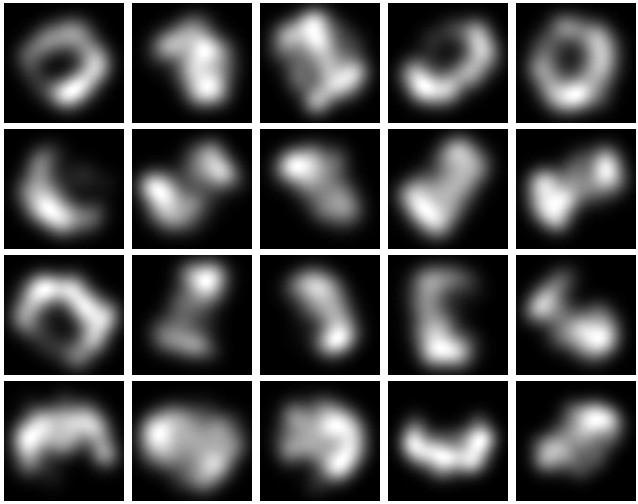
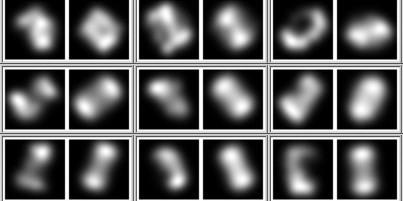
I use imagemagick a lot! Mostly, it's for generating various montages and comparison images. I'll combine the input and output images of a particular experiment in three different ways:
The first is quite easy to generate:
montage $1/in_*.jpg $1/montage_in.jpg
montage $1/out_*.jpg $1/montage_out.jpg
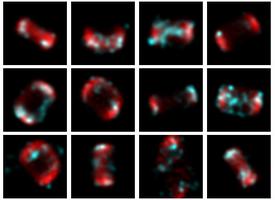
The second one is a bit trickier and relies on generating the two images above:
convert '(' $1/montage_out.jpg -flatten -grayscale Rec709Luminance ')'\
'(' $1/montage_in.jpg -flatten -grayscale Rec709Luminance ')'\
'(' -clone 0-1 -compose luminize -composite ')'\
    -channel RGB -combine $1/diff.png
Finally, combining input and output side-by-side looks like this:
!/bin/bash
files_in=($1/in_*.jpg)
files_out=($1/out_*.jpg)
counter=1
while [ $counter -le ${#files_in[@]} ]
do
   out_file=`printf pair_%05d.jpg ${counter}`;
   montage -tile 2x1 ${files_in[$counter]} ${files_out[$counter]} /tmp/$out_file
   ((counter++))
done
montage -frame 3 -geometry 128x64 /tmp/pair_* $1/pair_montage.jpg
rm /tmp/pair_*
Speaking of gifs and animation, I make use of ffmpeg quite a bit. Generating mp4 files from a series of jpgs is quite easy:
ffmpeg -r 24 -i %03d.jpg test1800.mp4
This command assumes you want a 24 frames-per-second framerate and that your jpgs all being with three numbers (up to three leading zeroes in this case).
Converting these mp4 files into gifs is also quite easy:
ffmpeg -i input.mov -s 320x240 -r 10 -pix_fmt rgb24 output.gif
Although I must admit, these animated gifs don't seem as robust as others. I've seen them not render correctly under certain circumstances. I'm probably missing something.
Another thing I'd not heard of; image-j beloved by microscopists and biologists! I can sort of see why. It's a program that has many useful features and several plugins. As a tool that can read and manipulate almost all image formats known to human-kind, it's definitely worth having in your arsenal. It's just a shame it's written in Java, with it's slightly wonky user-interface. Still, nevermind; it's got tonnes of features and options for scientific images. Definitely worth having in your toolbox.
Fiji is the name given to image-j packaged with a load of useful plugins, and is often referred to in lieu of image-j.
I've never had a lot of luck understanding how to plot in python. Matplotlib is fine I suppose, but I find it rather complicated. ggplot exists for python but in the end, I decided on pandas and seaborn, mostly because the images rendered in seaborn are really pretty (I occasionally use matplotlib too, as there are plenty of examples out there).
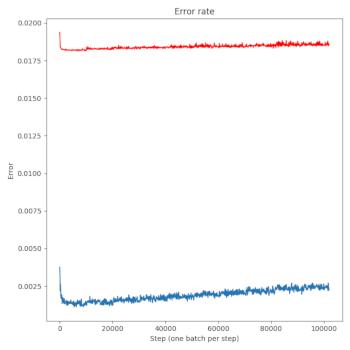
Generating line plots and heatmaps are my main things at the moment. You can get a reasonable line plot (of, say, your training and test errors from your neural net) like this:
import matplotlib
import seaborn as sns
import pandas as pd
import matplotlib.pyplot as plt

fig, axes = plt.subplots(nrows=1, ncols=1, figsize=(7, 7))
step = []
error = []
test_error = []
with open(args.savedir + "/stats_train.txt", "r") as f:
  for line in f.readlines():
    tokens = line.split(",")
    step.append(int(math.floor(float(tokens[0]))))
    error.append(float(tokens[2]))
with open(args.savedir + "/stats_test.txt", "r") as f:
  for line in f.readlines():
    tokens = line.split(",")
    #step.append(int(math.floor(float(tokens[0]))))
    test_error.append(float(tokens[2]))
# plot the error thus far
axes.set_title("Error rate")
axes.plot(step, error, color='C0')
axes.plot(step, test_error, color='red')
axes.set_xlabel("Step (one batch per step)")
axes.set_ylabel("Error")
fig.tight_layout()
fig.savefig(args.savedir + '/error_train_graph.png')
plt.close(fig)
At the moment, I really only use Pandas to create heatmaps. At some point, when I get around to doing more involved stats, I might use Pandas a little more. I create a dataframe and then pass it to seaborn like so:
import matplotlib
import seaborn as sns
import pandas as pd
import matplotlib.pyplot as plt

def plot_heatmap_activations(self, filename):
    dframe_active = pd.DataFrame()
    for idx, actives in enumerate(self.fc2_activations) :
        active = np.array(actives.flatten(), dtype=np.float)
        dframe_active["rot" + str(idx).zfill(3)] = active

    sns.heatmap(dframe_active)
    plt.savefig(filename)
    plt.close()
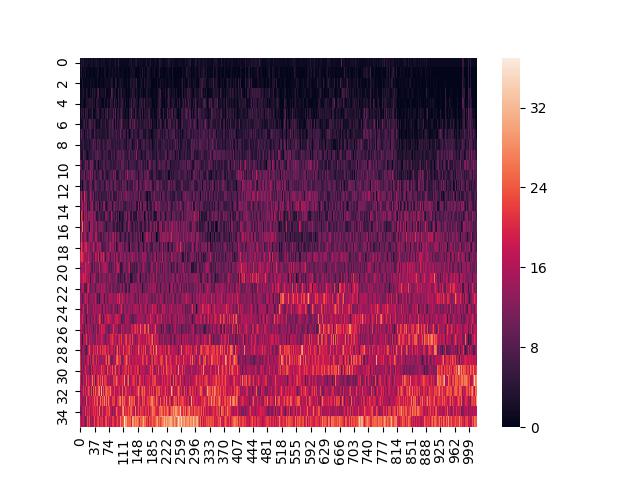
Image-J is a little heavy weight if what you want to do is skim over a huge number of images quickly, in order to get a sense of what you are dealing with.
I looked around for the right command line image viewer. Programs such as feh seemed like they might work, but when you are dealing with things like tiffs that can have tiny and huge values and multiple stacks, such programs just give you a black rectangle. Using a visual file browser like nautilus tends to fail too, as you end up waiting for the program to generate thumbnails for hundreds of thousands of images.
In the end I wrote a small program called fex (for Fits EXplorer) that looks inside a directory for FITS and TIFF files and renders them out using some normalisation, averaging over the stacks and providing a little information. It's faster and more reliable than any other methods I've tried, though it's a bit more work. It's not really ready for prime-time use by anyone else, but it's up there so folks can get a sense of what writing rust programs with gtk and libtiff is like.
Visualise early and visualise often! It's advice I should take myself! If I can't see the data or what the network is doing, I don't really know where to go next.
When working on an A.I. project most folks leap to tensorboard. It's quite a nice library this one, but it has one fatal flaw - it generates massive log files! Now this may have changed in the more recent version (I've not really played with Tensorflow 2) but unless you do a fair bit of tweaking, you'll be running out of disk space.
I also have an additional criterion - sharing experiments quickly and easily with folks in different places. This means publishing to the web. With these requirements in mind, I settled on a flask and WebGL based approach, running on my own web-server.
Flask is pretty straight-forward to use and provides some nice logic for doing simple things, like ordering experiments by date. WebGL is used to visualise how our network moves around the points during training - invaluable in spotting some of the failure modes.
It's important to make your visualisation routine as easy as a one button press I reckon. If it becomes a faff, I suspect it won't enter your regular routine. To that end, I have several evaluation python programs, all tied together in a single bash script. This script can be added to and changed as required. Once all the visualisation files are generated, the script uploads to the server automatically, and it's there ready to view.