I don't often talk about my work on the internet - it's been somewhat under wraps for a while now. But just recently, I've had a little breakthrough, writing up my results in a paper and getting all the code and data ready for folks to review online. Since it's definitely computer related, I figure I'd finally get around to posting something.
At the moment, I'm a PhD student working in the fields of artificial intelligence, bioinformatics and microscopy. I've been trying to see if we can get 3D structures out of 2D microscopy images, using deep-learning. Turns out the answer might be yes.
For the last few years, my supervisors and I have been working remotely, running experiments, sharing data online and chatting over Microsoft Teams, in order to get to this point. The global pandemic has had a considerable impact on PhD students all around the world, especially these who require lab access, and I've been no exception. I've had to build a significant amount of infrastructure as well as do the actual research - some of these ideas might be useful for other folks.
Microscopes come in all shapes and sizes. Some work with visible light, others with electrons, some even work with atomic force - effectively feeling their way around and object. It all depends on what you want to look at. Some microscopes are great for looking at live animals, others are designed for looking at very small things like proteins and, well, viruses.
We are looking at things around the 100s of nanometres scale or so (a nanometre is 0.000000001 metres - about single molecule resolution). At about 100nm we are just passed the wavelength of visible light, getting into ultraviolet territory. A lot of bacteria are around this sort of scale, and yes, some Viruses range from around 300 to 80 nanometres.
Sadly, there's a bit of a problem - physics. Well, specifically, Diffraction. When light passes through some sort of aperture like a slit or a hole, as it most certainly does when it hits some sort of sensor, it diffracts, or spreads out. So all the nicely ordered and focused light shining on our object of interest (especially, if it comes from a laser), ends up all fuzzy and blurred. This is known as the Airy Disk. If you are a photographer, astronomer or anyone who deals with images, chances are you've come across this. It's no different with microscopes.
Ultimately, diffraction sets the limit on how much detail we can get, assuming we have a perfect lens. This limit is called the Abbe Limit and is expressed as:
In the equation above, NA is the numerical aperture. If we have a value of 1.4 (for example) we'd be limited to roughly 180nm with blue light. Close, but not quite good enough to get the detail we need.
Thankfully though, some clever folk came up with Single Molecule Localisation Microscopy or SMLM, and specifically, Stochastic Optical Reconstruction Microscopy(or STORM for short). This form of microscopy is part of a family of techniques known as Super Resolution Microscopy. So called because they can cheat their way past the Abbe limit by making a few sacrifices.
STORM does this by being a little random. Let's say we have an object we are interested in. We can design some little labels called fluorophores and attach them to our object. Fluorophores are small chemicals, or antibodies with a bit that glows in a particular wavelength when it's illuminated with another light source. Imagine a Christmas tree with all it's lights turned off, standing there in the dark. You can't really make out it's shape. As soon as you turn on the xmas lights, the shape of the tree becomes apparent. This is what we are doing with STORM microscopy.
But theres a twist. Imagine, in our Christmas tree example, we either had poor eyesight and had forgotten our glasses, or we were using a camera and it was out of focus. As we turn the lights on, we'd end up with a really blurry picture. Let's suppose we can't change our focus. What do we do then? What if, rather than turning on all the lights at once, we turned them on, one at a time and took several pictures, one for each light. We could probably work out where the centre of this light was couldn't we? We can mark it's position down and then move on to the next light. In effect, this is what STORM microscopy does. We sacrifice time, in order to get detail.
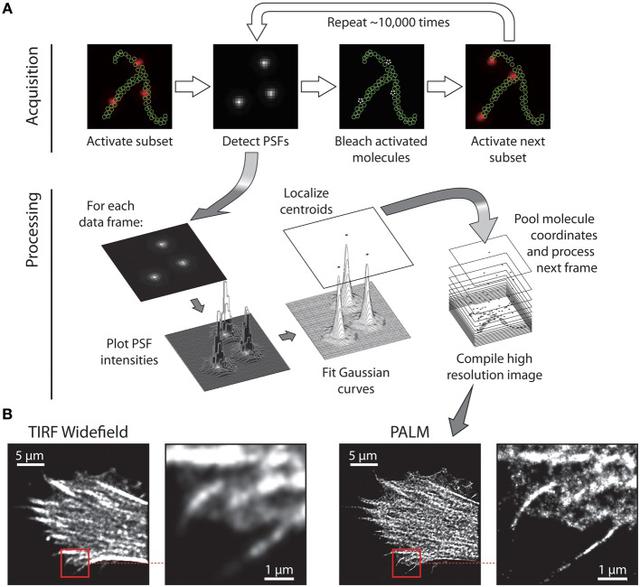
Of course, there is a little more to it. We can't turn on each fluorophore one-by-one. It's a more random process than that (hence the word Stochastic in STORM). Sometimes we might get two little lights that both turn on together and they are a little too close. Maybe sometimes, a light turns on but it's a little feint? There are many sources of noise basically, but there are ways around them.
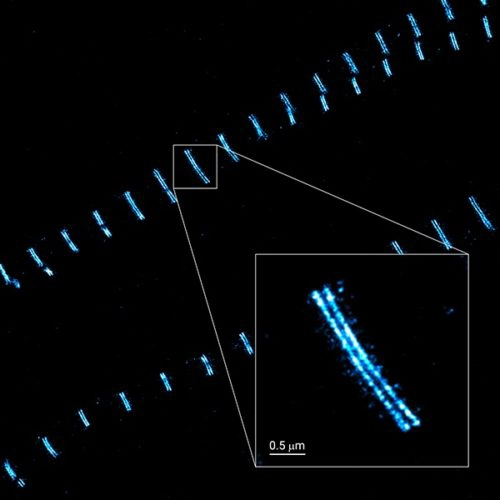
So, we've successfully got some 2D images of a particular object, like a protein complex (in our case, a centriole). How do we turn these 2D images into some sort of 3D model? Well, this is all quite easy you might think. We've had 3D reconstruction for ages, like photogrammetry or Shape from shade or even existing AI based approaches. Sadly, this doesn't work too well with our problem for a few reasons.
Firstly, we don't have any depth information. Given the scales we are working at, we have no perspective. Most of the existing methods rely on some sort of depth perception which we simply don't have. Second, our objects are noisy and organic - there is a lot of variation due to bits missing, fluorophores not being where they should be and so forth. Finally, our images are showing light intensity, not solid surfaces. Almost all of the examples of 3D reconstruction I could find, deal with solid objects like chairs, planes or cups. None of these objects are transparent; they are collections of surfaces that obscure and occlude one-another. Our objects are made up of small points of light that combine and add up, making a volume of varying intensity. Quite a different problem.
But fear not! It turns out we can create a neural network that can help. What we do is we create a differentiable renderer, a bit like the program DIRT. Such a renderer takes some 3D points in Euclidean space and spits out a rasterised 2D image; anyone who has done any 3D computer graphics will recognise this sort of thing. It forms the basis of almost all 3D computer games for instance. The trick here though is the differentiable part. It means we can figure out a gradient at each step of the process. We can therefore perform backpropagation, going from our image, all the way back to the weights of our network.
For these not familiar with 3D graphics, the process is like a pipeline, with triangles and points passing through various stages, until you get the nice pixels out at the end. If you look at modern GPU pipelines they are quite complex indeed, but if we look at a higher level of abstraction, things become a little easier. If we take out the specifics of the hardware and consider it from a mathematical point of view, the question becomes 'how do we transform these 3D shapes in our imagined world into 2D pixels on the screen?'. We have to model things like perspective, how big our camera sensor is, where our camera is positioned etc. All of that can be performed with a suprisingly small number of matrix multiplications. At it's heart, 3D computer graphics is linear algebra.
Don't let that put you off though! The operations are fairly simple. You start with something called a modelview matrix, which moves and rotates your world into a certain position. Next, is a multiplication by a persepctive matrix (if you want accurate persepctive, or a super wide angle lens or something like that). The clipping multiplication comes next, followed finally by the viewport transform. All of these operations are multiplications by a 4x4 matrix on your 3D points. This process has never really changed and you can google for "OpenGL/DirectX Graphics Pipeline" to find out more. If we keep this simple, we can differentiate over all these oprations, which let's us perform deep-learning on these images, going backwards from the image to discover what parameters (like translation and rotation) were used to create the image we are seeing.
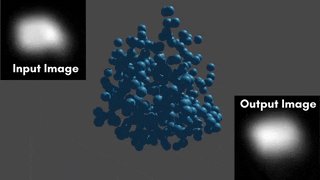
We can now think about a general solution. We can start with a random assortment of points and an input image. We throw our input image to our neural network, which attempts to find the position and orientation of the object in the image. Combine these parameters - translation and rotation - with some random points in the differentiable renderer and bingo! We have an output image that will no doubt look awful. But that's okay! We can directly compare the input with the output and backpropagate the error (or loss) back along to both our network and our random collections of points, making these points a little less random and a bit more structured.
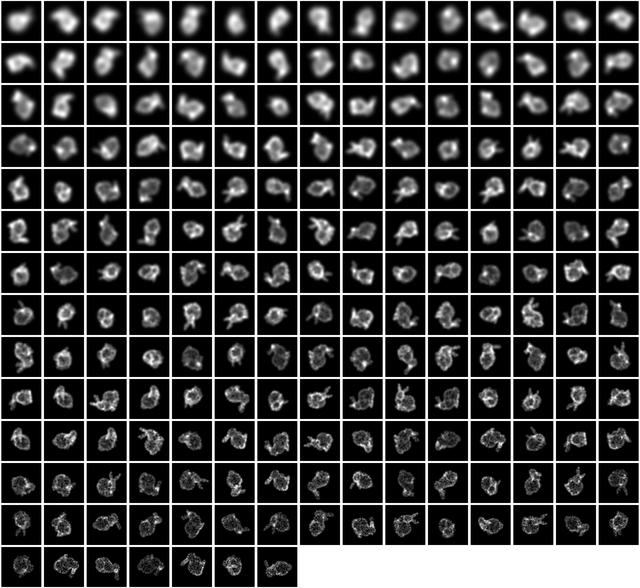
So what does it look like? Well, we start with a bunch of images that look a bit like this:
... and we get images that look like this:

We can visualise the point cloud too, from the initial random cloud, to the final structure. It looks a little like this:
So we've got something that seems to work. Job done right? Well, sadly not. As this is science we need to prove our experiment - see if it's actually doing what we think (and hope!) it's doing. We need experiments - lots of experiments!

I've been working away at this project for almost 3 years. For the first year I was remote. As soon as I got back to the UK, the pandemic hit, so being back in the office was not an option. I basically had to figure out a way to share my results remotely. Fairly easy you'd think right?
Well it would be, if my internet hadn't broken! Thanks to the pandemic, an engineer couldn't come out to fix it. So what to do?
Firstly, I managed to get an internet connection via the 4G network using a giffgaff sim card and a special 4G router. But how to access my AI box remotely? For that, I used wireguard which seemed much easier to setup than OpenVPN and was relatively robust.
I run a number of virtual machines, leased from jump networkds ltd based in London. I figured I could use one of these to share the experiments with my supervisors remotely. Using nginx, I built a website, a 3D visualisation for the web using pxljs, and a bunch of graphs using matplotlib, pandas and seaborn. Using a single bash script I could generate a bunch of stats, images and the like, and upload them to the server. The server had a small flask based web-application running in the background. When a new experiment was uploaded, the script would update the site.
All that was fine for a while, but it suffered a bit from one problem. When you are doing science you don't really know what you are looking for, or rather, you start in one place, but you could end up in another. The statistics we were interested in at the beginning of the PhD changed as we went forward. That meant the code had to change, the webpage would need to change and suddenly, having everything under one program didn't really work.
I changed over to jupyter notebooks. At first, I tried Jupyter Hub but installing that was a pain so I went with the single user version. This way, I could mess about with the raw data, generate graphs and stats server side, inside of client side and have a bespoke page for every experiment. The problem was, how to store the data in a format we could mess with?
I started out with redis - a cache program used by lots of online services. I re-wrote my stats program to record things I wanted to record during test and training, saving everything in BSON format. I could then write this BSON to a local Redis server, then use Redis's replication feature to make sure the server was up-to-date with the AI box. Using wireguard, it was quite easy for the server to talk to the AI box. This system worked great, until it really didn't!
I'd underestimated the amount of data we were producing. Very quickly, the server began to run out of memory and space. I needed an answer and fast! I turned to my old friend postgresql. It turns out that postgresql can handle BSON natively - no need for any silly NoSQL stuff (I've tried Mongo and couch and all these and I can't really get them to work for me). I figured Redis would keep just the most recent results (pretty much what it's designed to do really) and if the result wasn't available in the cache, the server would ask postgresql on the AI box instead. This worked a treat and still does to this day.
One thing I miss about the first approach is the 3D visualisation I made. It was very basic, but it worked and was helpful. There is a lack of good 3D software out there for Jupyter. There is a jupyer threejs plugin but it's not been worked on in a while. Tensorflow nightly has just released a 3D mesh and point cloud plugin for tensorboard but I've yet to try it. Overall, there's scope here for someone to write a really good suite of 3D graph tools for the web. Maybe there is one out there and I've not found it yet?
It's important to share your work - possibly the most important thing! Peer review is a big part of the science, though the current publishing model has some serious problems. Before I get to these I'll briefly mention how I went about writing a paper.
Firstly, I started with manuskript (as scrivener doesn't exist for Linux). It's more of a story writing tool but it does allow one to make various sections, recombine them, move them around and what not. It's a good idea for getting a basic overview done.
I use Latex in the most part, using tools like texstudio. However, such tools aren't particularly good for collaboration. Writing a paper almost always involves multiple authors. In addition, different journals and different disciplines have different styles. I'm really used to the more computer-science-conference style of paper. But since I'm in a cross disciplinary area, I've had to learn different styles (biology papers are very different!). So in the end, we moved to overleaf which is a great website. It's likely I'll be using it for my thesis too.
I would recommend the book Science Fictions by Stuart Ritchie (who I found out, works in my faculty at King's College) if you want to understand the problems with the publishing model. The incentives in science are in the wrong place. Big publishers charge a lot for both access to papers and for publishing them in the first place (over £1000 in some cases! Incredible!). Our paper is under review at time of writing but it will be placed on the biorxiv so anyone can see it. I'm a big fan of open access publishing; I think if the public is paying my wages, they should have access to the results.
But papers are just the beginning. Perhaps the most important thing is reproducibility.
In the book Science Fictions, Stuart Ritchie points out the reproducibility crisis in science. So many studies just don't hold up when the experiments are re-run. Why? Because researchers are incentivised to publish papers. Not write good code, not verify other researchers' work or re-run experiments. It's all about how many papers you publish, and that's just terrible!
So much science depends on software. Anyone who has worked in science will know that academic code is some of the worst code out there. No tests, no comments, no documentation, no installers or containers. And even if the software works, the data might not be available or in the right format. I've seen this time and time again when I was a research software engineer. Some places are recognising this - the UK is leading the world in recognising the importance of good research software, through the software sustainability institute and the UK Society of Research Software Engineering. In addition, places such as Zenodo are providing free hosting for your scientific data. So options are beginning to appear.
Don't think this is relevant or important? Think again. Neil Ferguson was hauled over the coals when it was revealed that the software he and his group had built to model the COVID outbreak was terrible. No-one won in the arguments that followed. Everyone's favourite Twitter troll Elon Musk accused Ferguson of being 'an utter tool', which is not helpful at best, and downright horrible at worst. In the end, Professor Ferguson resigned. My personal take on this is that it's hard to admit you can't do everything - such important code could have been worked on by a joint team of Software Engineers and Epidemiologists. Sadly, the incentives for writing good code in this manner just aren't there. This is but one of the many incidences of either non-engineering people not knowing their limitations, or just not having the time - 'getting something working' so the paper can be published.
I get a bit ranty over this because in the world of data and software, it should be as simply as running one command to verify results. In fact, it could be made automatic. It would take a lot of effort but if we care about science being reproducible - which we do because it is the most important rule of experimental science - then incentives need to be put in place to make this happen. Let's not rate scientists on how many papers they publish but on how good their science is.
To that end, all our code can be found on github. Our raw data and results on Zenodo. But, and this is an important point, do please be fair and friendly in your criticisms. Sometimes, people fear putting their code out there, for risk of being torn down by self righteous programmers and aresholes on Twitter (Elon Musk is back again I see!), and that doesn't solve the problem. The other side of the bargain is if we want better science software, critics need to be constructive.
If you want to write good software for science, there are some great guidelines and checklists out there including:
Our program HOLLy is now out there in the world, ready to be used and verified by anyone who wants to have a go. I hope it'll be useful for these working with high-throughput microscopy data. The story isn't over yet. No doubt I'll need to revise the code, update the documentation, maybe add some features or take away others. The paper itself is still under review at the moment - there will be corrections and things to change no doubt (It's well understood that reviewer 2 is always a pain in the arse).
But for now, I'm moving on to the next stage of my research, where we take what we've learned and apply it to a totally different area and a slightly different problem.